Quarantine
Epidemic Simulation
See descriptionQuarantine
Description
# Disclaimer
I'm not an epidemiologist. Neither the simulation nor any content I've shown here isn't necessarily true. For more detailed and correct information, I strongly suggest you listen to the experts and the medical center.
# SIR model
The statistical behavior of a virus spread can be described using the SIR model.
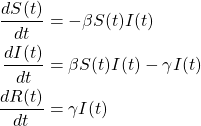
(Fig.1) SIR model
The definitions of these parameters are:
| Susceptible | People who are not yet infected. They are also not immune to the virus. |
| Infectious | People who have been infected. They can transmit the virus to the susceptible. |
| Removed | People who have been recovered or deceased from the virus. They don't transmit the virus. |
# How Simulation Works
The largest panel (which might look like the following) shows the present situation of the community.
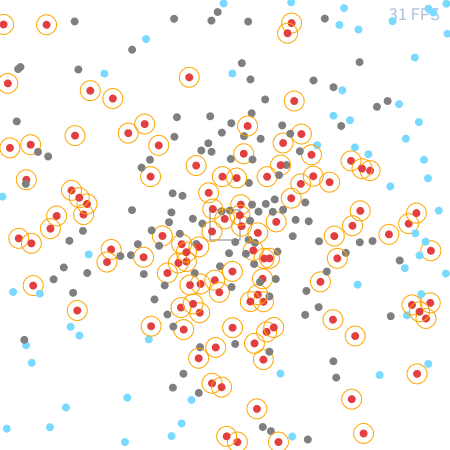
(Fig.2) Distribution of people, FPS, and the Central Spot.
The gray rectangle located at the center in the image is "central spot". It's where people tend to gather such as supermarkets, public transportation, etc.
The top panel shows the changes in the number of Susceptible, Infectious, and Removed.
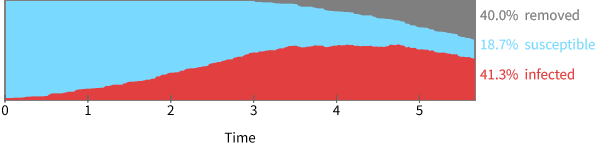
(Fig.3) Changes in the number of people in each status
The sliders can change the configuration of the simulation in real-time (except population).
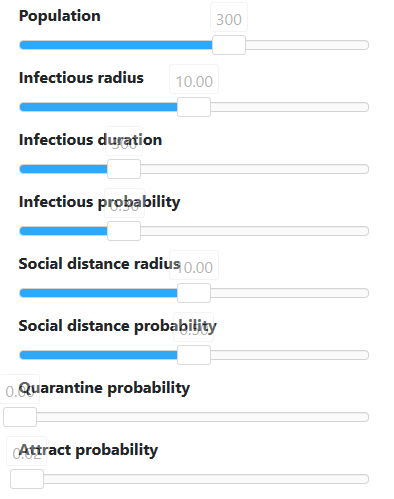
(Fig.4) Range Sliders for the parameters
| Label | Description |
|---|---|
| Population | Number of people in a community including those who are quarantined |
| Infectious radius | Effective infectious radius from the infected individual |
| Infectious duration | Duration until people recovers from illness |
| Infectious probability | Percent of being infected when encountered with an infected individual |
| Social distance radius | Radius from which people avoid approaching when they're closer |
| Social distance probability | Percent of all the people pay attention to social distancing |
| Quarantine probability | Percent of the infected people get quarantined |
| Attract probability | Percent of all the people gather at the populated spot |
The buttons enable you to control the simulation.

(Fig.5) Buttons
The Play button behaves like:
When the simulation is paused, the Play button will resume the simulation.
When the simulation is stopped, the Play button will reset and restart the simulation.
# Reference
- Melting Asphalt "Outbreak"
- 3Blue1Brown "Simulating an epidemic"
- The Washington Post "Why outbreaks like coronavirus spread exponentially, and how to “flatten the curve”"
Go back to top
more simulations on https://stellacontrail.github.io/simulations/
This simulation is licensed under the MIT License.
more simulations on https://stellacontrail.github.io/simulations/
This simulation is licensed under the MIT License.